No more jumping between tabs: how Databox turns data chaos into clear conclusions (with help from AI)
Picture a Monday morning in a modern company. Marketing checks the numbers in Google Analytics 4 and Meta Ads. Sales analyses funnels in HubSpot. The product team tracks metrics in Mixpanel, and finance looks at subscriptions in Stripe. The result? To answer a simple question, “How are we doing this month?”, a manager has to open a dozen tabs, copy numbers into Excel by hand and spend half a day gluing charts together.
At Velg we believe time is the most valuable currency and manual reporting is a technological relic. So today we put Databox under the microscope: a no-code business intelligence (BI) platform that gathers scattered data and turns it into clear dashboards that work in real time.
If you want to stop guessing and start making decisions based on facts, here is why Databox should be on your radar.
What is Databox?
Databox is a tool built to democratise data. Traditional BI systems (such as Tableau or Power BI) require advanced engineering knowledge, writing SQL queries and building complicated data pipelines.
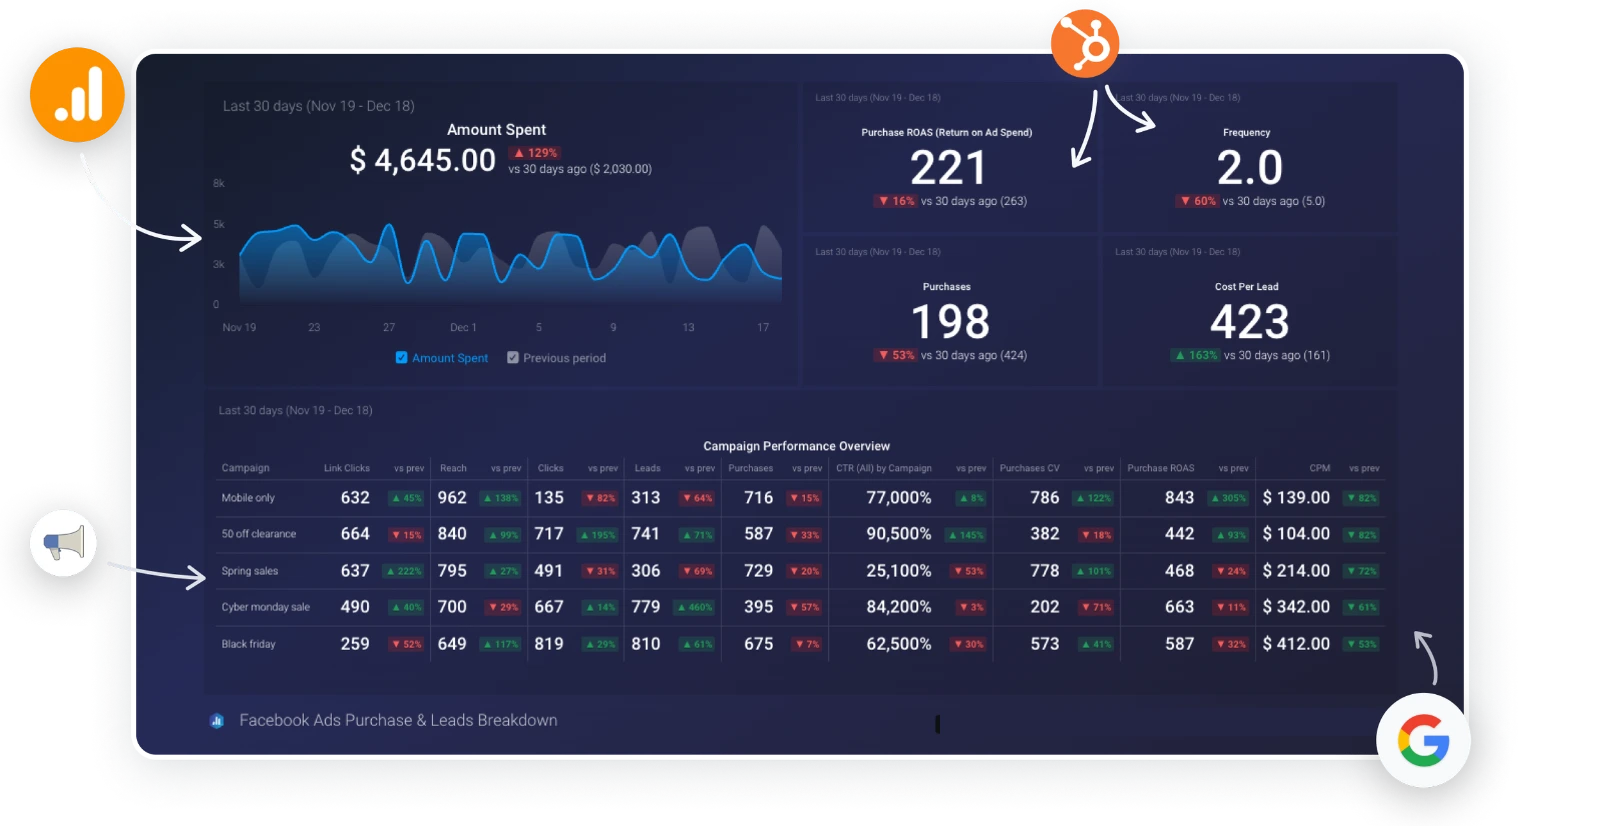
Databox goes in a completely different direction. It is a no-code platform that lets you connect more than 130 popular business tools in a few clicks. Instead of building a data architecture from scratch, you pick ready-made blocks, drag them onto the screen and have a good-looking dashboard that updates as you watch.
Features that do away with spreadsheets
Modern analytics is more than nice bars and pie charts. Databox offers a set of tools that take real load off operations teams:
1. More than 130 integrations and "Data Blending"
Whether you track ad performance on TikTok, conversion in Salesforce or team output in Jira, Databox brings those sources together in one place. Most importantly, Data Blending lets you mix data. For example, you can add up campaign costs from Google and Facebook and divide them by real revenue from Stripe, getting a precise ROI figure on a single chart.
2. Your personal AI analyst (Genie)
Data analysis can be dull and time-consuming. Databox solves that with artificial intelligence. With the AI module you no longer have to hunt for anomalies yourself. The system writes short text summaries (AI Performance Summaries) that explain in plain language why traffic dropped last week or which marketing channels are burning budget. What is more, you can ask the platform a question in plain words (for example “Which campaigns brought the most leads this quarter?”) and the AI will prepare the right visualisation for you.
3. Forecasting and Smart Alerts
Instead of learning about a miss at the end of the month, in Databox you can set up forecast models (Forecast modeling). Based on historical data, the system tells you whether you will hit your targets at the current pace. If the growth curve suddenly dips, smart alerts notify the team on Slack or by email at once, before the problem grows into a crisis.
4. A distinctive touch: dashboards on the TV screen
This is a feature modern offices love. Databox has a dedicated Stream to TV option. It lets you show the company's key metrics on large screens in the office with no fuss. Nothing motivates a sales or development team like a constantly updating counter of closed deals or delivered tasks that everyone can see.
Databox or another analytics tool?
Quick tip: If you work only within the Google ecosystem, Looker Studio may be enough. But if your tech stack is a mosaic of different SaaS products, Databox will save you dozens of hours of engineering work.
Velg's view: why build a data-driven culture?
At Velg we know that intuition matters in business, but it is hard data that lets you scale operations without needless risk. Tools like Databox lift the curse of “grunt work” from teams: the tedious copying of data and formatting of reports for the board or for clients.
Automating analytics means that instead of wasting energy on creating reports, you invest it in drawing conclusions and acting. And in today's fast-changing world, the winners are those who react to change fastest.
Is your team still living in the era of manual reports in Excel? Maybe it is time to give automation a chance and let artificial intelligence do the grunt work.